
-
Similar Content
-
- 1 reply
- 684 views
-
- 0 replies
- 393 views
-
- 6 replies
- 954 views
-
-
Who's Online 11 Members, 0 Anonymous, 217 Guests (See full list)
-
Images


-
Tell a friend
-
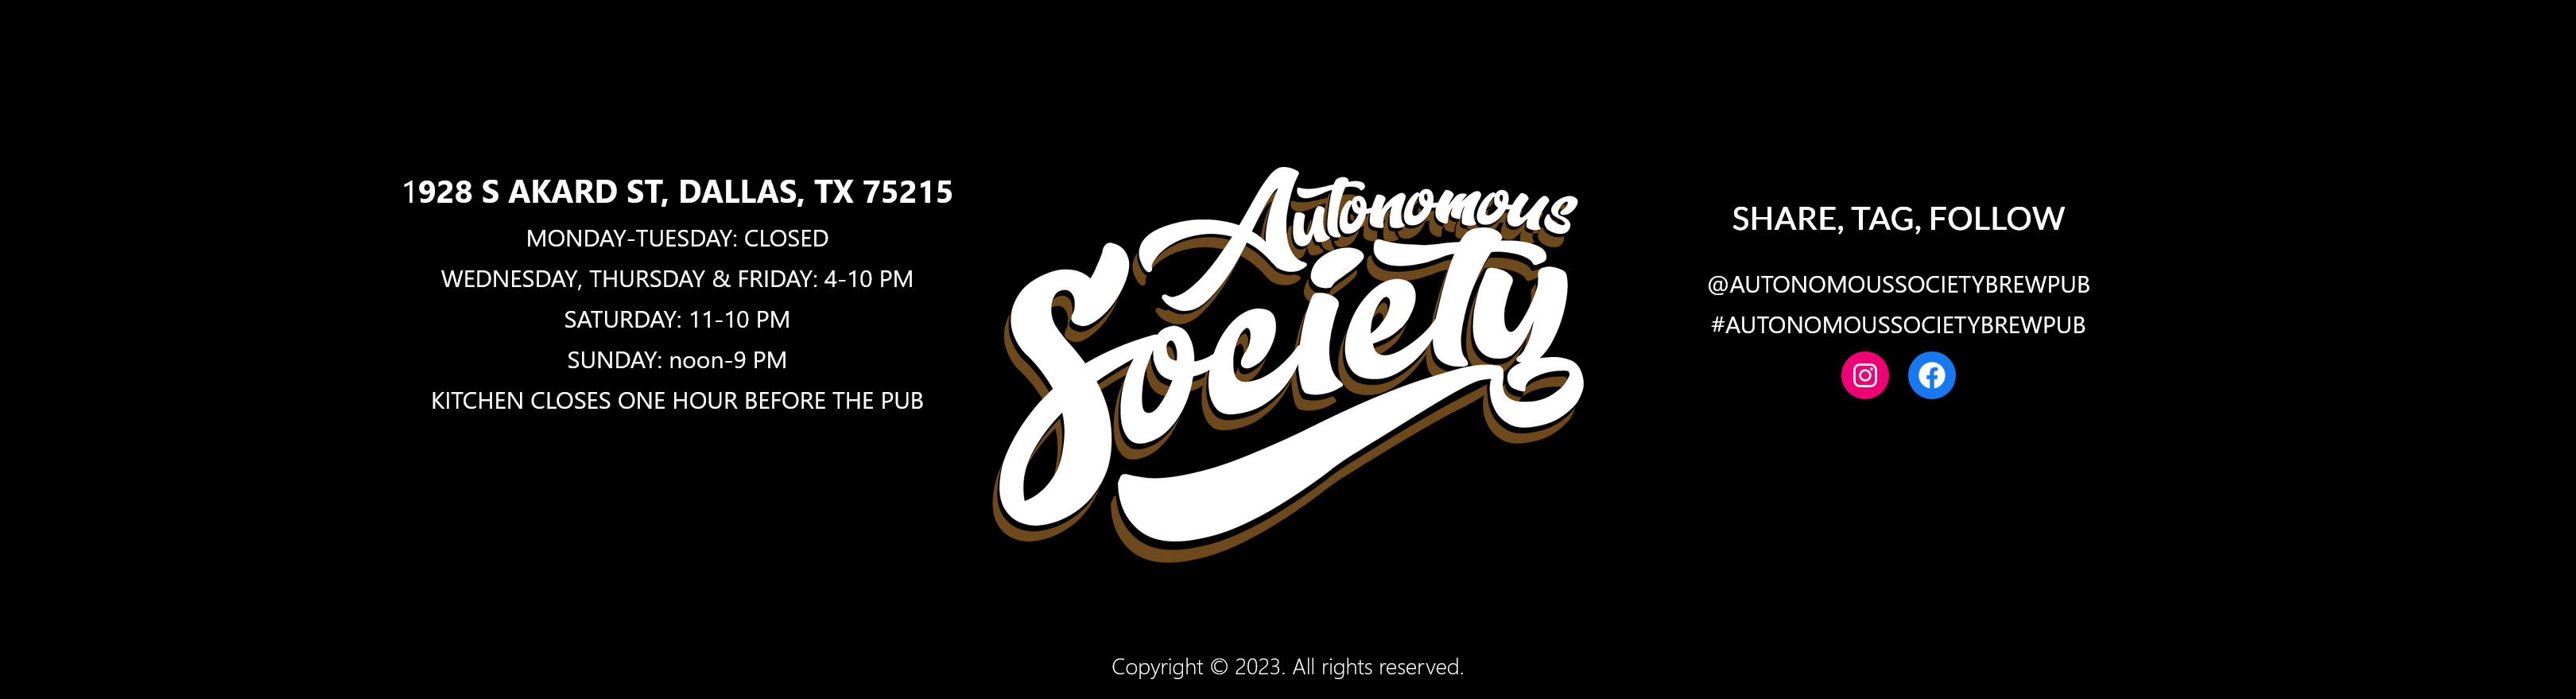
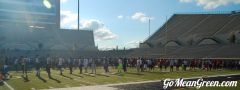
What's going on Mean Green?
-
6
Best BBQ in each Texas college football town
That's my pick as well, and I do love 407 BBQ. -
32
-
6
Best BBQ in each Texas college football town
I stand by Metzler's in Denton. Great food, reasonably priced and long time supporters of UNT.- 1
-

-
47
When are we going to hear some good news?
Heard that Edwards, Scott and Buggs were all visiting Memphis. Doubt that all three end up there but how weird would that be? -
6
-
-
Popular Contributors
-
1

-
2
-
3
-
4
-
5
-
-
Member Statistics
-


Recommended Posts
Join the conversation
You can post now and register later. If you have an account, sign in now to post with your account.
Note: Your post will require moderator approval before it will be visible.