

ScreamingEaglesFan
-
Posts
520 -
Joined
-
Last visited
-
Points
12,085 [ Donate ]
About ScreamingEaglesFan

- Birthday 04/12/1970
Recent Profile Visitors
4,796 profile views


ScreamingEaglesFan's Achievements
")


-

DCTF ROF: CFB Expansion Talk
ScreamingEaglesFan replied to Glory to the Green's topic in Mean Green Football
I saw this on Twitter/X by @TJAltimore and thought it was interesting. I really thought we’d rank higher but the methodology made sense. From his tweet the modeling methodology. HOW THIS MODEL CALCULATES SCORES: For each factor, a range of metrics were weighted based on expert input, evaluated based on quantifiable data, and scored with statistical comparisons. Below is a quick overview of the methodology used in scoring. Please note that all individual data points are publicly available. Any school officials, conf officials, clients, or media staff with questions are free to reach out, and I’d be happy to set up time walk you through relevant data / findings / benchmarks, or custom analysis that may be of interest. 🏈 FOOTBALL SUCCESS: (Most heavily weighted, by far) – On-Field Success (Last 5 Year, Last 20 Years, All-Time) – TV Attractiveness (2016-23 – Total Viewers, Avg. Viewers, Rated Games, Network Games) – Fan Support and Facilities – Resources & Investment 📊 MARKET POTENTIAL: – Local Regional Market – State Market – Football Prominence Rank in State 🏆 ATHLETIC & HOOPS SUCCESS: – Resources / Investment – Scale (Teams / Athletes) – On-Field Success (DC Points / Team NCs / Athlete NCs) – Basketball Success (Last 5 Year, Last 20 Years, All-Time Tourney Success) – Basketball Fan Support 🎓 INSTITUTIONAL RESOURCES & ACADEMIC SUCCESS: – U.S. Institutional Rank (USN & WR) – Global Rank (ARWU/SR + THE ranks) – Research (Single Campus / Aggregated) – Resources (Budgets / Endowments) – Size & Scale (Enrollment / Graduates / FTE Staff) – Popularity (Applications / Yield Rate) – Selectivity (Admit Rate) ✅ KEY BONUS FACTORS: – AAU Membership – State Flagship Status – Land-Grant Status – Elite Academic Status (Top 100 NatU / LAs) – Established Power Conf. Member (Pre-2023) 🚨 NEGATIVE RISK DEDUCTIONS: – Problematic School Scandals – Control Risks and School Leadership Issues Note that any conferences, schools, and networks will have different factors that matter to them, and they will particularly vary based on TV contract considerations, carriage fee arrangements, rivalries and connections, and distributions of current members. As such, this can only provide a general quantification for illustrative comparison.
-
That's all i needed to see!! I'm sold!!
-
Kratch that, we need a new LB Coach
ScreamingEaglesFan replied to jtm0097's topic in Mean Green Football
I heard the Packers are considering him for DC -
Stepping down but will still be involved in campus with courses in leadership and science behind food. https://www.dallasnews.com/news/education/2024/02/06/unt-president-neal-smatresk-resigning-after-decade-leading-the-university/?outputType=amp
-
Mason - Signed for 2 more years by Saskatchewan
ScreamingEaglesFan replied to El Paso Eagle's topic in Mean Green Football
This Canadian sports writer is definitely not a fan of Mason!! https://leaderpost.com/sports/football/cfl/saskatchewan-roughriders/darrell-davis-roughriders-re-signed-qb-mason-fine-really/wcm/a2fae08f-867a-4134-aab7-47dce795ab6c/amp/ -
Tulane Fan Board on UNT game
ScreamingEaglesFan replied to Ross Hodgeson's topic in Mean Green Basketball
Here was my tweet to Pat Downy an on air personality.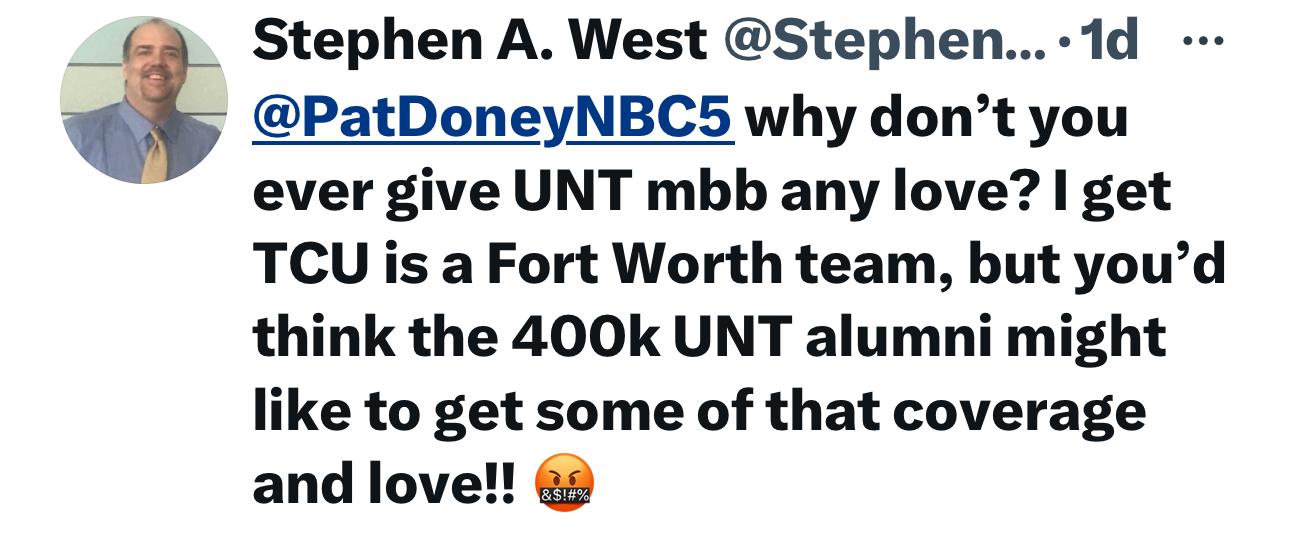
-
Are we not signing a transfer QB?
ScreamingEaglesFan replied to meangreenfaninno's topic in Mean Green Football
Yes -
I love the 28-4 point run by our mean green!!
-
January 8th . Mondays at noon

- 1 reply
-
- 2
-

-
My understanding is that even when we offer someone a full ride the scholarships are truly only for a year and are basically just not renewed in these type situations.
-
***UNT vs Tulane In-Game Discussion Thread***
ScreamingEaglesFan replied to Coach Andy Mac's topic in Mean Green Football
Well hell!! -
I'm out of town but was curious I saw you can sync our radio with the TV broadcast. Does anybody know how to do that?
-
Did anyone catch any comments from Morris after the game? Is there an archived post game show?
-
Cash McCullum (9/15) stats
ScreamingEaglesFan replied to ScreamingEaglesFan's topic in Mean Green Football
And with the three highly ranked receivers we've got coming in will definitely be fun watching everyone develop.